
How to Read Candlestick Charts Like a Pro: The Complete Mastery Guide for Traders
Candlestick charts are the universal language of the markets. Whether someone trades stocks, forex, crypto, commodities, or indices like NIFTY and BANKNIFTY, candlesticks remain the most powerful way to visualize price. Their strength lies in their simplicity. Each candle tells a story. Each wick carries a message. Each body reflects a battle between buyers and sellers. When combined over time, these candles form patterns, trends, traps, reversals, and continuations that reveal the true psychology of the market. Learning how to read candlestick charts like a pro is not about memorizing dozens of patterns but about understanding the emotional forces behind every candle. Only then can a trader unlock the hidden structure of price and follow the market’s rhythm with confidence.
In this blog, you will learn how professional traders read candlesticks in today’s fast-paced markets. You will understand how candles behave in trends, in consolidations, at support and resistance, during breakouts, during panic selling, and during manipulative liquidity grabs. This guide will serve as a deep, complete, and practical education on reading candlestick charts at a professional level, written in the same premium format as your previous blogs.
The Origin of Candlestick Analysis and Why It Still Works
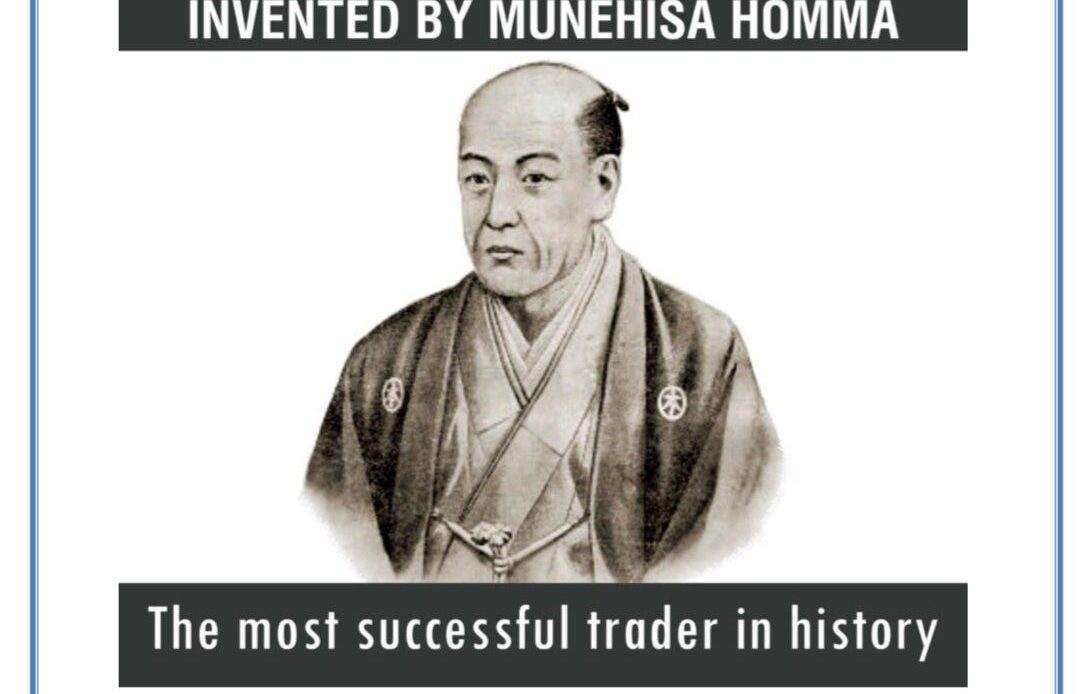
Candlestick charting was developed centuries ago by Japanese rice traders who discovered that human behaviour repeats itself. They created a visual method of representing price that captured market psychology in a simple, elegant format. Even today, in algorithm-driven markets, candlestick charts continue to be the most widely used tool because human emotion remains the core driver of market volatility. Whether it is fear, greed, indecision, manipulation, profit booking, accumulation, or distribution, all these behaviours appear clearly on candlestick charts.
The reason candlestick charts still work is that price action is not random. Every candle shows how traders reacted to information. The open reflects initial expectations, the high shows optimism or stop-hunt attempts, the low reflects pessimism or liquidity grabs, and the close shows the final consensus. This dynamic creates patterns that repeat every single day across every timeframe. When traders learn how to interpret these signals, they gain an edge that indicators simply cannot offer.
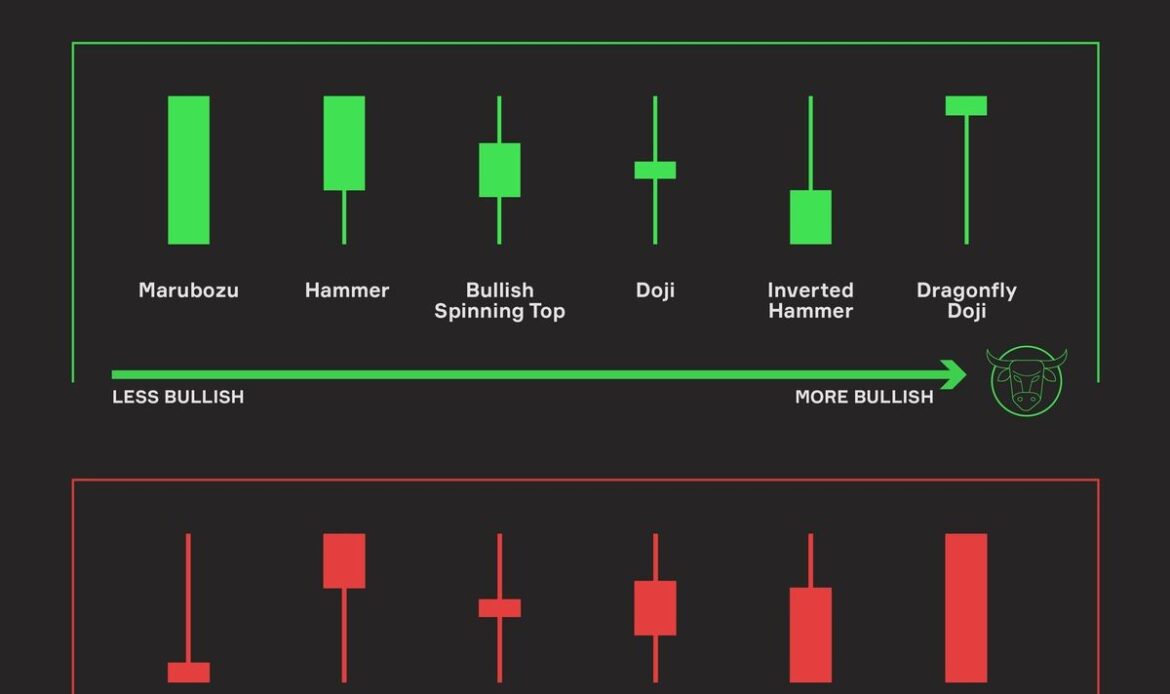
Understanding the Structure of a Candlestick
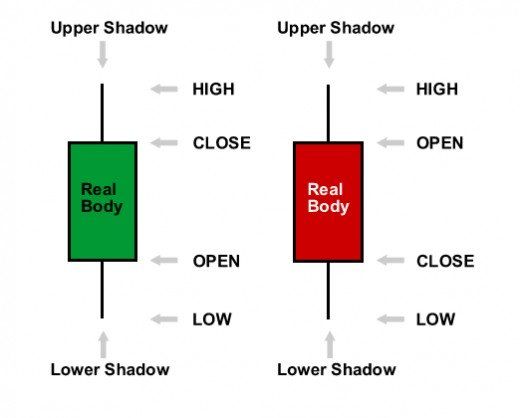
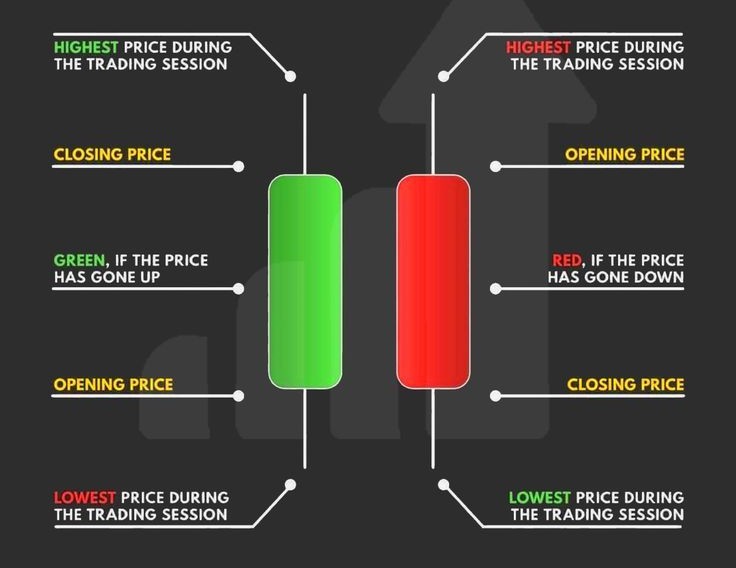
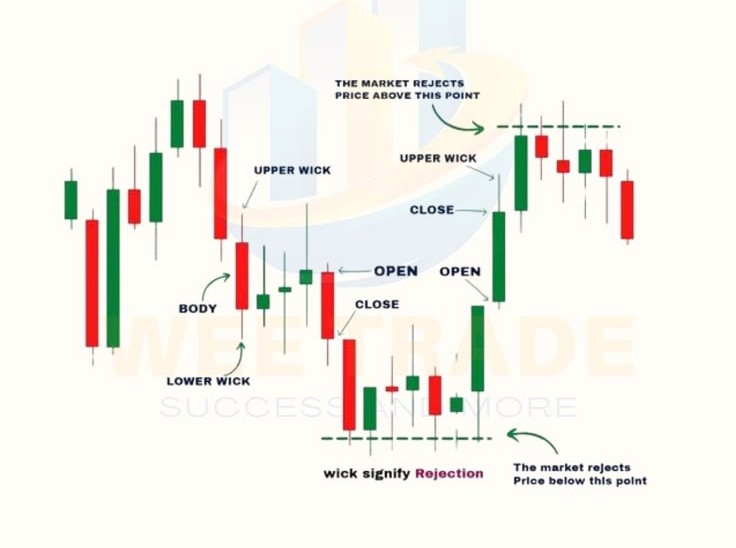
Each candlestick contains four important data points that shape its story. The open is where the battle begins. The close is where the battle ends. The high shows how far buyers were able to push before facing resistance. The low shows how far sellers could push before encountering support. The relationship between these four values determines the candle’s strength. Candles with strong bodies reflect decisive moves, while candles with long wicks reflect rejection. Small-bodied candles reflect indecision.
The magic lies in how these components interact. A candle with a strong body closing near its high indicates strong buying pressure. A candle with a long upper wick shows selling pressure or profit booking at higher levels. A candle with a long lower wick reveals buying interest at lower levels. When these candles appear at key levels in the market, they provide powerful clues about upcoming moves.
The Psychology Behind Each Candle
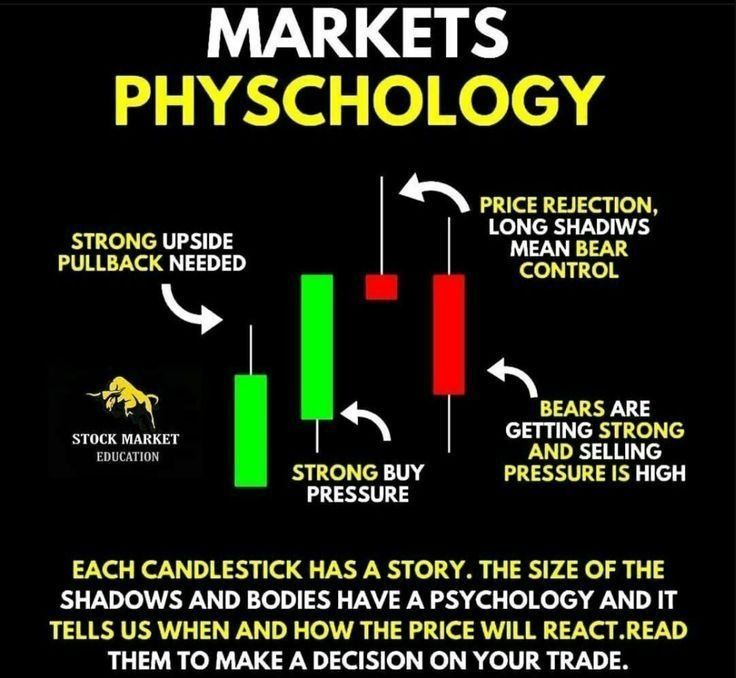
Candlestick reading is not about memorizing shapes but understanding psychology. Every candle is a reflection of the emotional struggle between buyers and sellers. A bullish candle shows that buyers dominated the session. A bearish candle shows sellers were in control. A doji reflects uncertainty. But the context matters more than the candle itself. A strong bullish candle formed at resistance may simply be a liquidity grab, while the same candle formed at a major support zone may signal a strong trend reversal.
Professional traders focus on the message behind the candle, not the textbook name of the pattern. They analyse who is trapped, who is in control, and where smart money might be accumulating or distributing. This mindset allows them to trade with precision and avoid the classic mistakes made by retail traders.
How Professionals Read Price Action Candle by Candle
Professionals read candlestick charts in layers. They analyse how one candle transitions into the next. If a strong bullish candle appears but the next candle fails to continue the momentum, it indicates weakness. If a bearish candle forms but the next candle rejects the lows, it indicates hidden strength. Pro traders pay attention to how candles break previous highs or lows, how they close relative to important levels, and how their size compares to surrounding candles. A sudden large candle after a series of small candles often signals an imbalance or a breakout attempt.
This candle-by-candle analysis helps traders understand whether the market is accepting price at a certain level or rejecting it. Acceptance means the market is comfortable trading at that level. Rejection means traders are unwilling to sustain price there. This insight is crucial for understanding trend strength, breakout validity, and reversal potential.
How Candlesticks Behave in Trending Markets
In a trending market, candlestick behaviour becomes more predictable. In an uptrend, bullish candles tend to be larger and more frequent, while bearish candles become smaller and corrective. Pullbacks often show wicks on the downside as buyers re-enter at discounted levels. In a downtrend, bearish candles dominate while bullish candles become smaller and less impactful. Each retracement produces upper wicks as sellers use the rise to add positions.
Understanding this rhythm is essential because it allows a trader to differentiate between a normal pullback and a trend reversal. If bullish candles start shrinking and bearish candles start expanding in an uptrend, the trend may be weakening. Similarly, in a downtrend, if sellers start losing strength and bullish candles begin closing strongly near their highs, a reversal may be brewing.
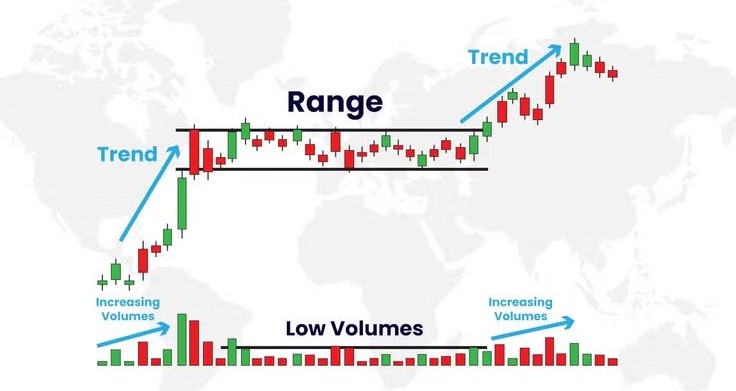
How Candlesticks Behave in Range-Bound Markets

In consolidation zones or sideways markets, candlesticks tell a very different story. Buyers and sellers battle for dominance, resulting in alternating candles with inconsistent follow-through. Candle bodies tend to be smaller, wicks become longer, and reversals occur frequently. These conditions trap traders who mistake consolidations for trend continuations.
The key to reading candlesticks in ranges is to understand that the market is gathering liquidity. Each wick that pierces the range boundary often represents stop-hunting or fake breakouts engineered to trap impatient traders. A pro trader waits for confirmation of acceptance outside the range through strong candle closes. Once the market commits to a direction, the first breakout candle often sets the tone for the next trend.
Candlestick Rejection and How to Interpret Wicks
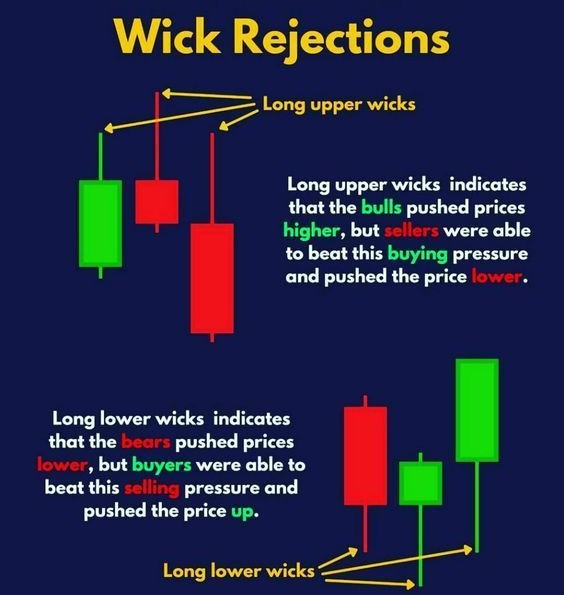
Wicks play a crucial role in reading candlestick charts like a pro. A long lower wick reflects strong buying interest. A long upper wick reflects strong selling pressure. When a long wick appears at a key support or resistance level, it often signals a reversal. For example, a long lower wick at support may indicate that sellers attempted to push the price down but failed. This failure often leads to a bounce. A long upper wick at resistance indicates buyers failed to break through, leading to potential downside.
The length of the wick relative to the body is important. A long wick with a tiny body represents extreme rejection. A long wick with a medium body shows partial rejection but still some control from the dominant side. These nuances help traders avoid false signals.
The Power of Candle Closes and Why They Matter
The closing price of a candle is the most important piece of information on the chart. Professionals watch closes with intensity because they reveal the final result of the battle. A strong close above resistance is far more important than simply touching resistance. A close below support is a stronger signal than a wick that temporarily dips below it. Breakouts confirmed by strong closes are more reliable. Failures to close beyond levels indicate weakness.
Candle closes also define trends. Higher closes indicate an uptrend gaining strength. Lower closes indicate sustained selling pressure. When candle closes start clustering near certain levels, it indicates accumulation or distribution.
Reading Candlesticks at Support and Resistance
Candlestick patterns gain power only when they occur at important levels. A bullish candle at resistance does not mean much. A bullish candle at support carries significant weight. Traders often make the mistake of ignoring context. The same pattern can be bullish or bearish depending on where it forms.
At support, look for rejection candles, long lower wicks, or strong bullish closes. These indicate buyers are stepping in. At resistance, look for rejection candles, long upper wicks, or weak closes. These indicate sellers are becoming aggressive. When a key level is approached with small candles followed by a sudden large candle, it often indicates a breakout or breakdown attempt.
How to Identify Real Breakouts Using Candles
Breakouts are one of the most manipulated areas of the market. Retail traders often chase breakouts only to get trapped when price reverses. Candlestick reading can help avoid false breakouts. Real breakouts usually occur with strong bodies and minimal wicks. They often show immediate follow-through in the next few candles. Fake breakouts often show long wicks, weak bodies, or hesitation candles immediately after breaking the level.
A real breakout usually retests the broken level with small candles and then continues. A false breakout will fail to close beyond the level and return inside the range with force.
How to Identify Market Manipulation Using Candles
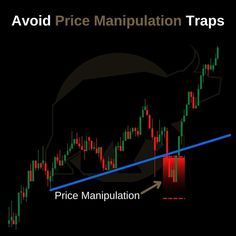
Smart money frequently uses candlestick psychology to manipulate price. They create wicks to hunt stops. They print large candles to induce panic. They trap traders with fake patterns. A professional trader can identify these moves. Long wicks at obvious levels are often engineered stop-hunts. Sudden large candles after long consolidations may be manipulation to trigger entries. Small indecision candles before news events indicate uncertainty in big money positioning.
Understanding manipulation helps traders avoid traps and align with institutional intentions.
The Importance of Volume with Candlestick Reading
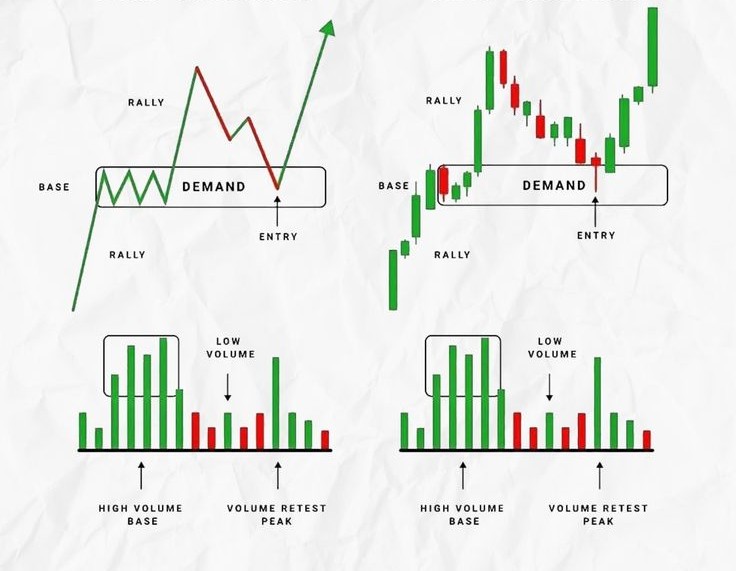
Volume adds depth to candlestick interpretation. A strong bullish candle with high volume indicates genuine buying strength. A bearish candle with low volume may simply be a pullback. Volume spikes combined with rejection candles often indicate high-intensity reversal attempts. When a breakout candle has high volume, it increases the probability of success. When a breakout happens with low volume, it may be false.
Volume combined with candles helps traders understand whether a move is real or simply noise.
How to Build a Pro-Level Candlestick Reading Strategy
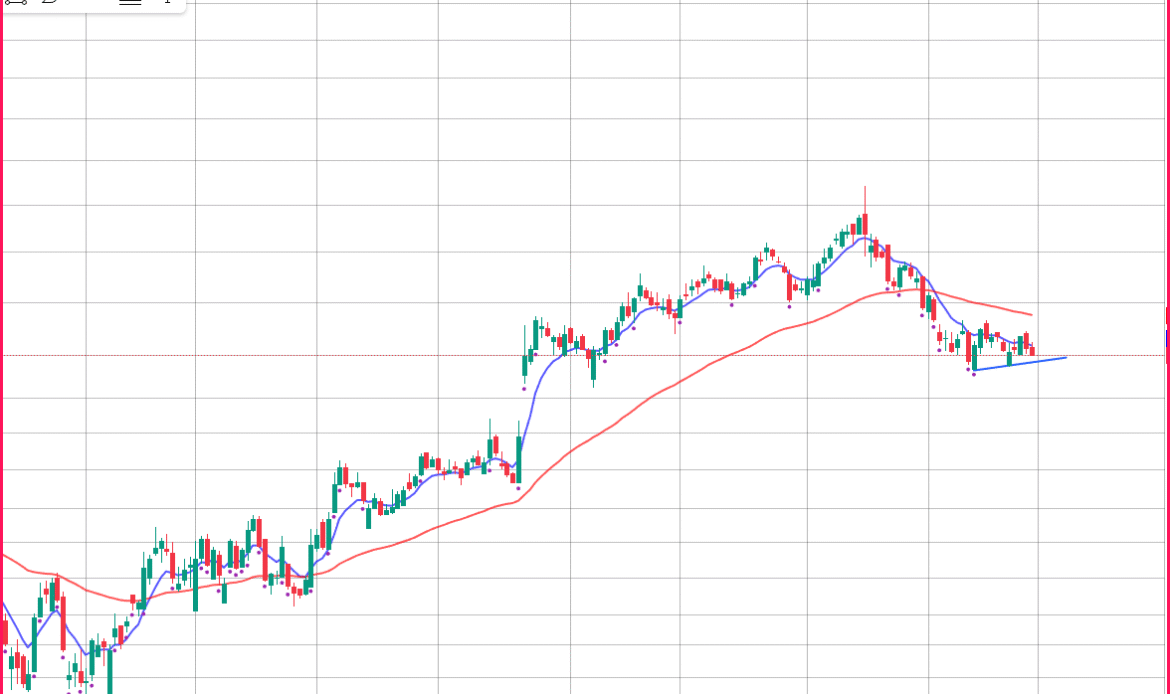
You can go short on this chart As this professional candlestick strategy begins with understanding market structure. Identify the trend. Map out the key levels. Observe how candles behave around these levels. Look for rejection, strength, weakness, or hesitation. Wait for confirmation from candle closes. Manage risk by placing stops near logical levels rather than arbitrary numbers. Use candlesticks to time entries and exits, not to predict the future.
The strategy must be rule-based and repeatable. Over time, the trader develops an instinct for reading candles in real market conditions.
Common Mistakes Traders Make When Reading Candlesticks– Nothing in markets is holy grail
Many traders misinterpret candlesticks because they look for holy-grail patterns. They memorize names but ignore context. They trade patterns that form in the middle of nowhere. They assume every doji or hammer is a reversal. They forget that the trend always dominates. Candlestick reading requires patience, discipline, and understanding of the broader picture. Without context, candlesticks can mislead even experienced traders.
Why Candlestick Reading Will Always Remain Relevant
Despite modern technology, AI-driven execution, and high-frequency trading, candlestick reading remains timeless. It captures the psychology that drives price. It reflects real-time reactions to news, liquidity, sentiment, and expectations. It works across markets and timeframes. No matter how advanced trading becomes, human emotion will always be visible in candles.
This is why candlestick charts continue to dominate all trading platforms even in 2025. They offer clarity that no indicator can match.
Conclusion
Reading candlestick charts like a pro is not a skill learned overnight. It is a craft built through observation, practice, and understanding of market psychology. Candles are the purest form of price action. They show strength, weakness, manipulation, liquidity, supply, demand, acceptance, and rejection in a single visual format. When a trader learns to interpret them deeply, trading becomes clearer, entries become sharper, and confidence becomes stronger. Candlestick reading is a timeless skill that will remain relevant no matter how markets evolve.