
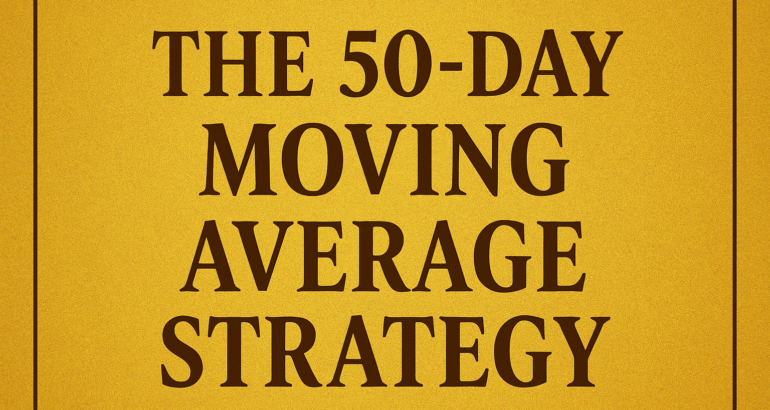
THE 50-DAY MOVING AVERAGE STRATEGY: THE MOST RELIABLE TREND TRADING SYSTEM FOR INDIAN MARKETS
The Indian stock market has grown rapidly over the last decade, attracting millions of new traders and investors. With rising financial awareness, affordable brokerage platforms, and easy access to TradingView-style charts, strategies once hidden among professional institutions are now widely adopted by retail traders. Among these strategies, the 50-day moving average has stood the test of time across global markets, especially in India where trends tend to extend for longer durations. This blog explores the 50-day moving average strategy in a comprehensive, 5000-word narrative designed for beginners, intermediate traders, and full-time professionals who want to trade with clarity and confidence.
The 50-day moving average is more than a line on the chart. It represents the market’s memory of the last fifty sessions, which captures both short-term and medium-term sentiment. When used correctly, this single line can reveal trend direction, momentum strength, potential reversal signals, and ideal buying or selling opportunities. Most importantly, it helps traders avoid sideways traps and emotionally-driven decisions. Professional traders rely on this tool because it filters noise and focuses only on meaningful market movement.
This blog will take you through the philosophy, psychology, application, and real-world behaviour of the 50-day moving average strategy. By the end, you’ll understand not only how to use it but also how to integrate it into a complete system for consistent trading results.
UNDERSTANDING THE POWER OF THE 50-DAY MOVING AVERAGE
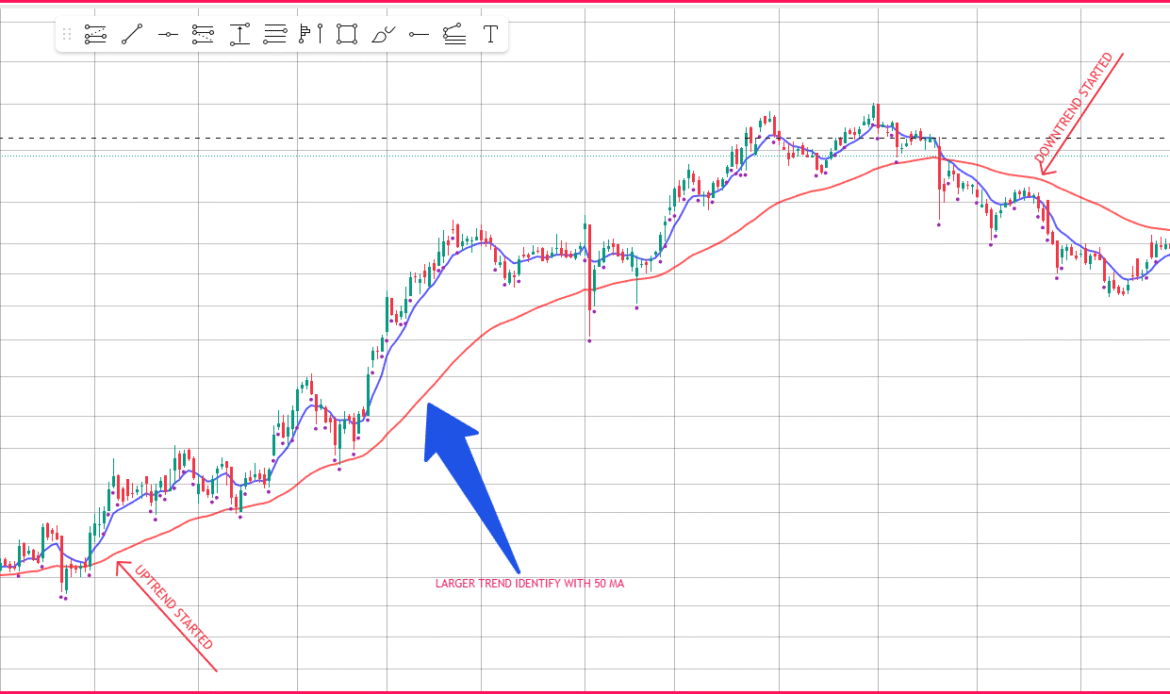
The 50-day moving average acts as a dynamic support and resistance zone. When a stock or index trades above this average, it signals that, on average, buyers are in control over the medium term. When it trades below, sellers dominate. Unlike static horizontal levels, this average adjusts continuously with market movement, making it adaptive and incredibly relevant for markets like India, where trends often evolve slowly and sustainably.
The reason the 50-day moving average is so reliable is that it balances noise reduction and timely signal generation. A very short average, such as 10 or 20 days, can be too reactive and generate frequent whipsaws. A very long average, like the 200-day moving average, reacts too slowly. The 50-day average sits precisely in the sweet spot, capturing shifts without reacting to every minor fluctuation. This has made it a favourite of institutions, mutual fund managers, swing traders, and positional trend-followers.
This is why major breakouts in stocks like Reliance, HDFC Bank, Tata Motors, and LTIMindtree often occur when prices decisively reclaim or bounce from the 50-day average. Similarly, breakdowns below this moving average frequently signal deeper trouble ahead, especially during bearish cycles or prolonged consolidations.
THE PSYCHOLOGY BEHIND THE 50-DMA STRATEGY
To truly master the 50-day moving average strategy, you must understand the psychology behind it. Markets are driven by collective expectations, reactions, fear, excitement, and institutional activity. The 50-day moving average reflects the average price traders have agreed upon over a meaningful period. When the price is above this level, traders who bought earlier feel profitable and confident, attracting more buyers. If the price dips towards the 50-day average, many traders wait for this level to enter again, expecting another leg of the trend.
During bearish phases, when the price slips below the 50-day average, the sentiment shifts. Traders start doubting the strength of the trend. Institutions reduce long exposure and may begin distributing. Retail traders get trapped trying to buy dips. This shift in psychology turns the 50-day average into a resistance zone. Each attempt to reclaim it is closely watched, and failure at this level often leads to further declines.
Understanding this emotional cycle helps traders follow the market’s natural rhythm instead of fighting it.
THE TREND-FOLLOWING NATURE OF THE 50-DMA SYSTEM

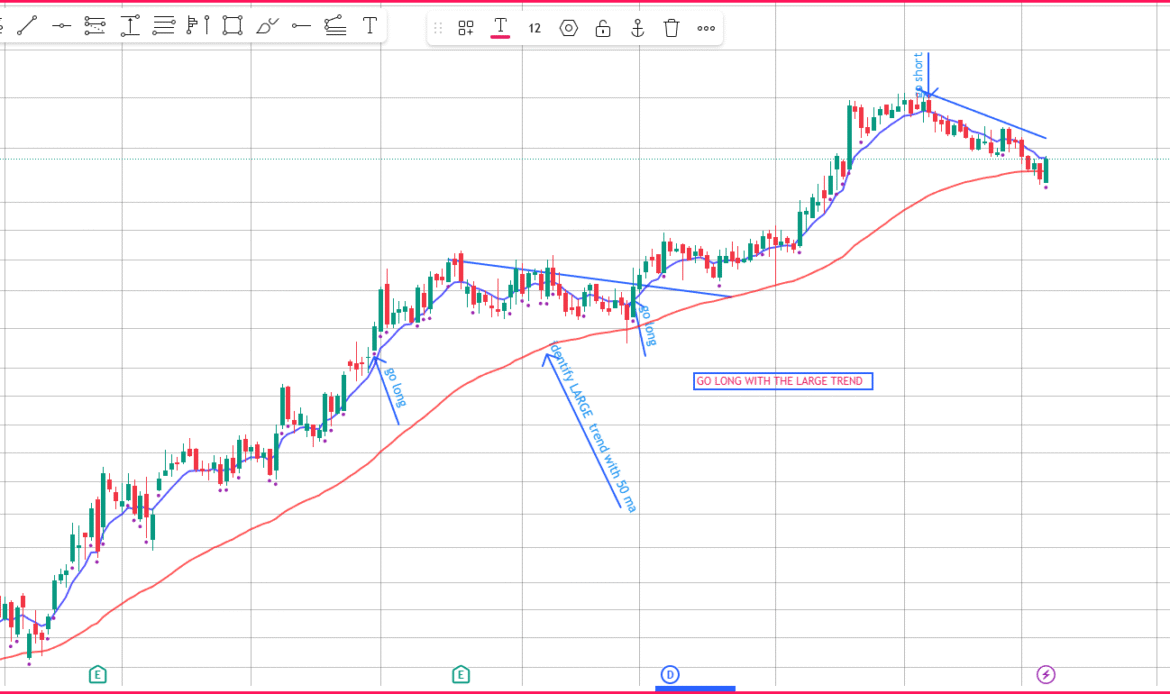
The beauty of the 50-day moving average strategy lies in its simplicity. It automatically keeps you aligned with the prevailing trend, preventing countertrend mistakes. Rather than predicting tops or bottoms, this strategy encourages reactive trading—entering only when the trend is visible and confirmed.
When the price consistently holds above the 50-day average, you are looking at a healthy uptrend. The stock attracts fresh demand on pullbacks, and every bounce from the 50-day average strengthens the trend further. This behaviour is seen repeatedly in trending stocks during bull markets, sector rotations, and momentum-driven phases.
Similarly, when the price persistently trades below the 50-day average, it reveals weakness. Trends tend to accelerate downward as stop-losses get triggered and demand weakens. Trying to buy during this phase is like catching a falling knife. The 50-day average acts as a shield by keeping you away from dangerous bottom-picking trades.
This approach is the foundation for long-term trend-followers, swing traders, and positional stock traders around the world.
IDENTIFYING A STRONG UP-TREND USING THE 50-DAY AVERAGE
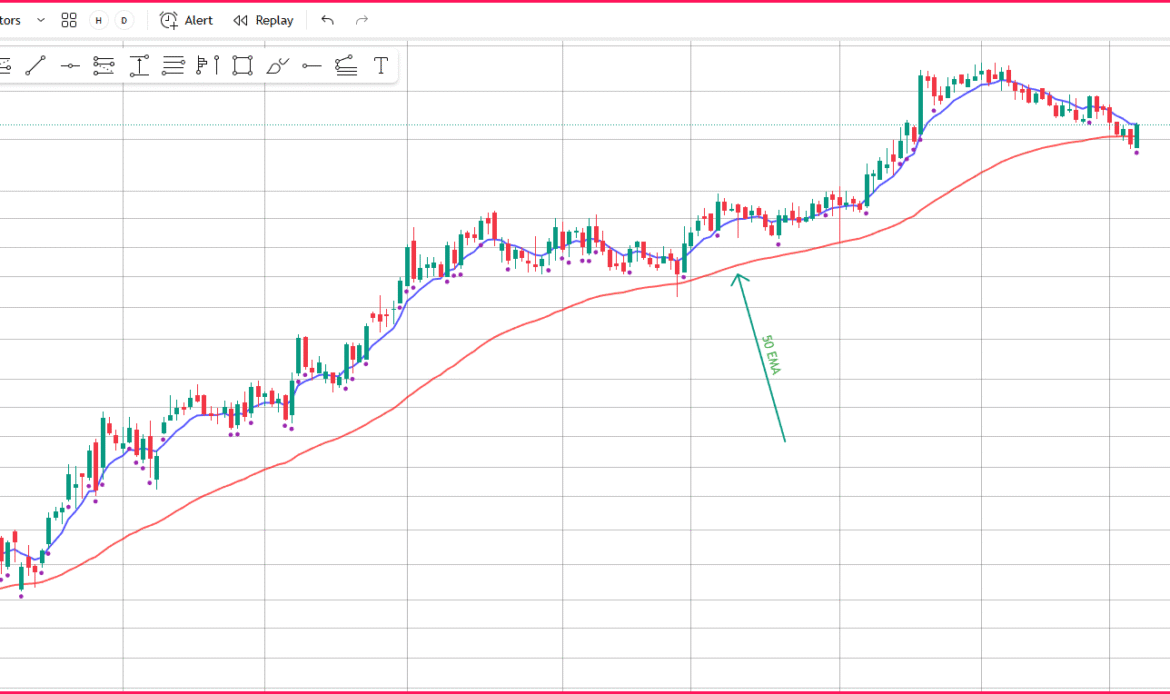
The strongest uptrends in the market behave in a very specific manner. The price moves upwards steadily, corrects in shallow pullbacks, and finds support near the 50-day average. This creates a staircase-like structure on the chart. Traders who enter during retracements benefit the most because their trades align with the dominant market direction.
The best way to identify a strong uptrend is to observe whether the price respects the 50-day average consistently over weeks or months. If a stock rarely closes below this level and bounces every time it approaches it, the trend is not only strong but also gaining investor confidence. This is how major multibagger moves begin—through sustained demand at key moving average levels.
When such behaviour becomes visible, traders must shift their mind-set from trading small swings to capturing bigger trends. This is the kind of trend where a trader might enter a stock like Titan, HDFC, or TCS early and ride the entire wave for weeks or months.
IDENTIFYING A STRONG DOWN-TREND USING THE SAME AVERAGE

In downtrends, the opposite happens. The price continuously faces resistance at the 50-day average. Every time it attempts to move up, sellers take control and push it down again. This repeated rejection forms a descending staircase pattern.
Recognising such behaviour early helps traders avoid taking long trades during dangerous phases. Stocks that consistently remain below the 50-day average are often undergoing distribution, negative news cycles, or structural weakness. Many traders lose money trying to “buy dips” in these phases, unaware that deeper declines are coming.
Using the 50-day average, traders can maintain a disciplined approach by avoiding long positions until the price convincingly moves above the moving average and sustains there.
THE 50-DMA PULLBACK ENTRY STRATEGY
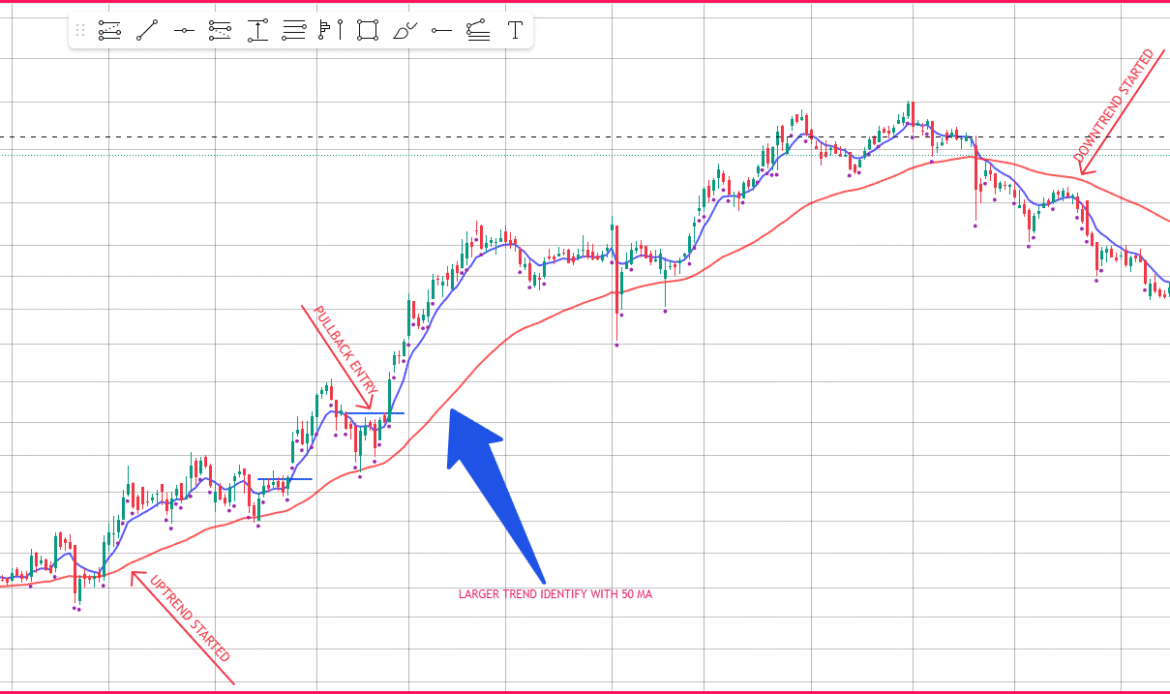
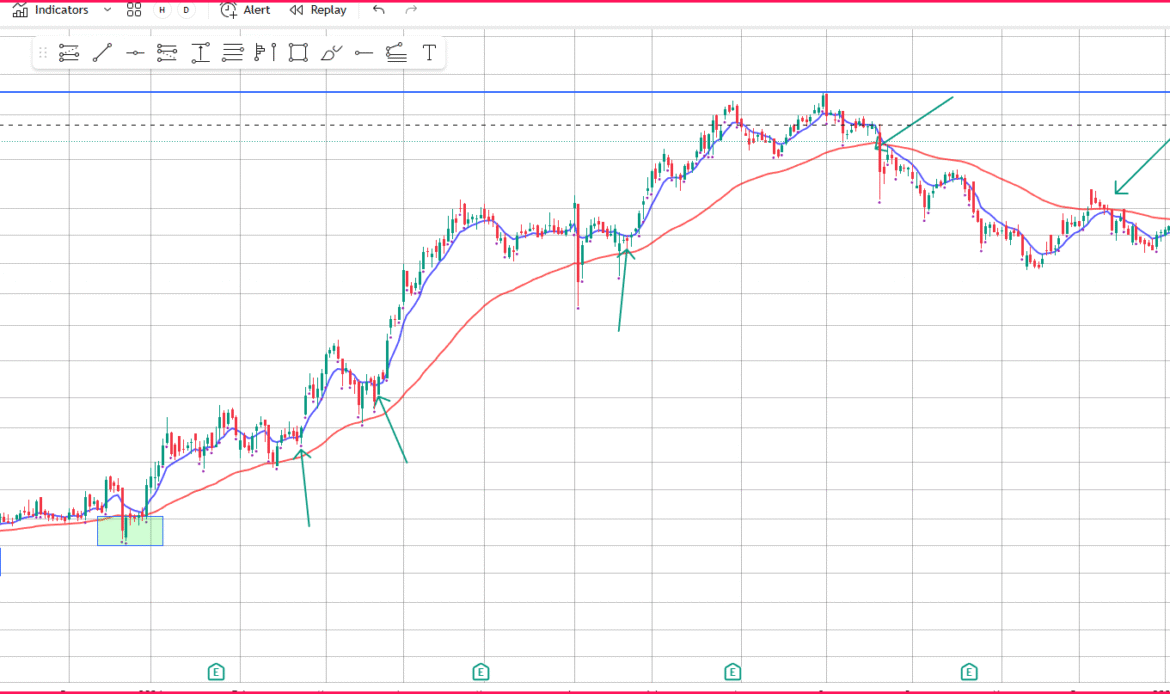
One of the most powerful ways to trade with the 50-day moving average is by entering during healthy pullbacks. When the price pulls back gradually towards the moving average without panic or heavy selling, it creates an ideal opportunity for low-risk, high-reward entries. This pullback acts as a filter to identify whether the trend is still intact.
If the stock consolidates near the 50-day average and prints stable candles, it signals that sellers are losing aggression. When the price breaks out from this zone with strong momentum, traders gain a perfect entry point. This method avoids chasing breakouts, reduces emotional decisions, and ensures you enter only after the trend proves its strength.
THE 50-DMA BREAKOUT STRATEGY
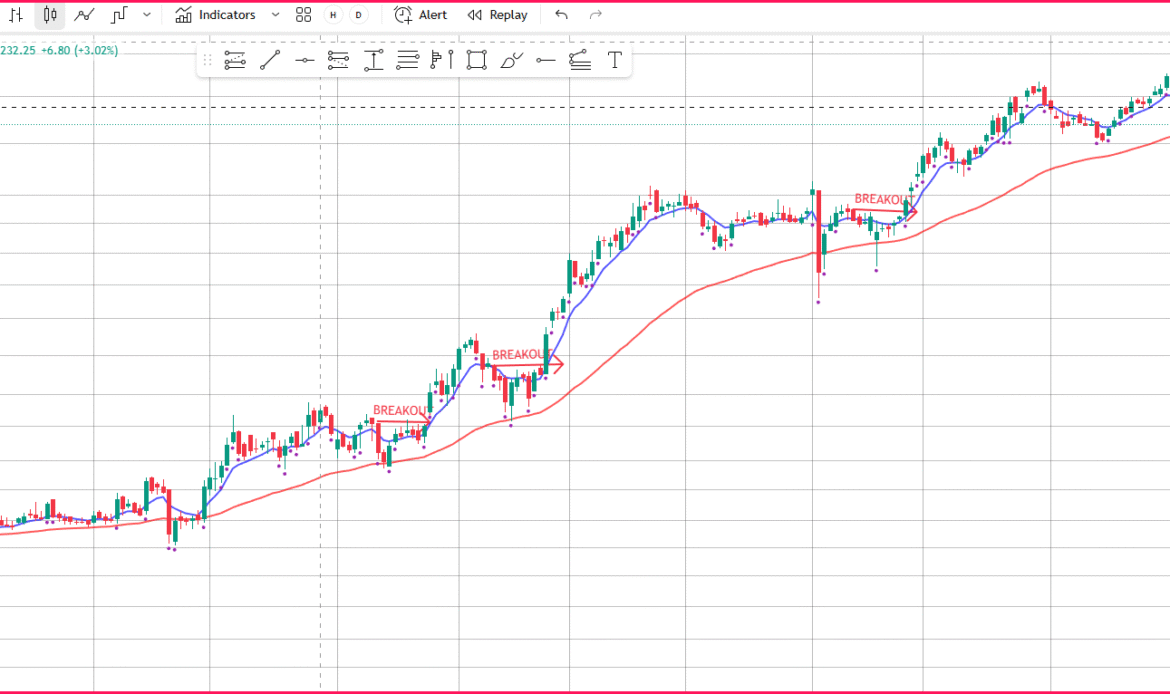
Another powerful usage of the 50-day average is during breakouts. When the price is trapped below the 50-day average for several sessions and eventually breaks above it with conviction, it often signals a trend reversal. This breakout is an early indication of changing momentum, especially when accompanied by strong follow-through candles.
Breakouts above the 50-day average can become the start of major rallies. Traders who catch these early breakouts often enjoy substantial gains as fresh trends form. However, it’s important not to rush; confirmation is crucial. A breakout that sustains is far more reliable than a breakout that struggles immediately afterward.
THE 50-DMA BREAKDOWN STRATEGY
Just as breakouts above the average are powerful, breakdowns below the 50-day average often lead to accelerated declines. If a stock repeatedly tests the 50-day average and finally closes below it with a strong bearish candle, it usually signals deeper weakness. This breakdown is a warning for investors to reduce positions or exit entirely. For traders, it opens opportunities for short positions on futures or options.
Breakdowns are particularly important during market corrections. A market like Nifty or Bank Nifty breaking below its 50-day average can trigger widespread selling across sectors. Such moments often create some of the best opportunities for positional shorts.
USING THE 50-DAY AVERAGE FOR SWING TRADING

Swing traders love the 50-day moving average because it offers clean patterns, well-defined zones, and strong follow-through. It prevents traders from entering during overextended moves by shifting the focus to pullbacks. Swing traders track stocks that are trending up strongly but temporarily correcting towards this average. When the retracement ends and the trend resumes, swing traders enter confidently with defined stops and targets.
This strategy also reduces stress because swings typically last from a few days to a few weeks, giving traders enough time to manage trades without monitoring charts all day.
USING THE 50-DAY AVERAGE FOR POSITIONAL TRADING
For positional traders, the 50-day moving average becomes a backbone of decision making. Stocks that stay above the average for long durations tend to generate powerful compounding returns. This is how many investors held stocks like Asian Paints, HDFC Bank, and Bajaj Finance during their multi-year bull runs—by relying on the moving average structure.
Positional traders use this strategy to stay invested until the trend genuinely weakens. The 50-day average becomes a trailing support zone. As long as the stock remains above it, the long-term structure remains intact.
USING THE 50-DMA STRATEGY FOR INTRADAY TRADING
Even intraday traders can adapt this strategy by observing how price interacts with the 50-period average on shorter timeframes. When combined with trend direction and pullback structure, intraday entries become extremely accurate. However, unlike swing or positional trades, intraday trades may require quicker decision-making and smaller targets.
HOW TO FILTER FALSE SIGNALS
Every strategy, including the 50-day moving average, can produce false signals during choppy conditions. Traders must learn to differentiate between genuine signals and traps. Avoid trading the 50-day average during sideways markets, news-heavy sessions, and low-volume environments. Always wait for confirmation candles rather than blindly entering at the crossover.
THE REAL STRENGTH OF THE STRATEGY: RISK MANAGEMENT
No strategy is complete without risk management. The 50-day average provides clear stop-loss zones and helps traders determine whether they are on the right side of the trend. By risking a small portion of capital and targeting larger moves, traders can achieve favourable reward-to-risk ratios.
BUILDING A COMPLETE TRADING SYSTEM AROUND THE 50-DMA
The 50-day average becomes extremely powerful when combined with structure reading, price-action zones, momentum candles, and sector analysis. This transforms it from a simple line into a complete trading system. Once you integrate these components, you not only enter high-probability trades but also avoid low-quality setups automatically.
CONCLUSION: THE 50-DAY MOVING AVERAGE STRATEGY IS EVERGREEN
The 50-day moving average strategy is one of the most trusted, reliable, and effective trading systems across global stock markets. Whether you are a beginner or an experienced trader, this strategy provides clarity on trend direction, ideal entries, clean exits, and strong risk control. It works beautifully across Indian stocks, indices, and commodities. Most importantly, its simplicity makes it timeless.
Trading does not need to be complicated. With discipline, patience, and consistent practice, the 50-day moving average strategy can become a cornerstone of your trading success.