

Pivot Points: The Ultimate Trading Blueprint for Indian Stock Market Traders in 2025
Pivot Points have quietly remained one of the strongest and most dependable tools in the trading world, even in 2025 where algorithms dominate order flow and markets move faster than ever. Although thousands of indicators flood TradingView today, very few have stood the test of time the way Pivot Points have. They were born in an era where floor traders relied on simple and practical methods to judge market direction, and yet the same logic continues to guide intraday traders, positional traders, option buyers, option sellers, institutional desks, and even modern prop trading algorithms in India. The beauty of Pivot Points lies in their simplicity: they take the previous day’s price behaviour and convert it into meaningful levels that act as natural support, resistance, turning points, profit zones, exhaustion areas, and equilibrium layers.
The concept of Pivot Points is rooted in the fundamental nature of price itself. Markets remember certain price levels. Traders remember certain zones. Reactions at these zones get repeated. Liquidity pools form around them. Stops get accumulated near them. Algorithms monitor them. When price approaches a Pivot level, the market pauses, breathes, reacts, or explodes depending on the ongoing sentiment. This behavioural reaction is why Pivot Points continue to be extremely powerful. Traders may change, technology may evolve, but human nature and crowd behaviour barely change, and Pivot Points effectively capture this psychological memory.
Understanding the Soul of Pivot Points
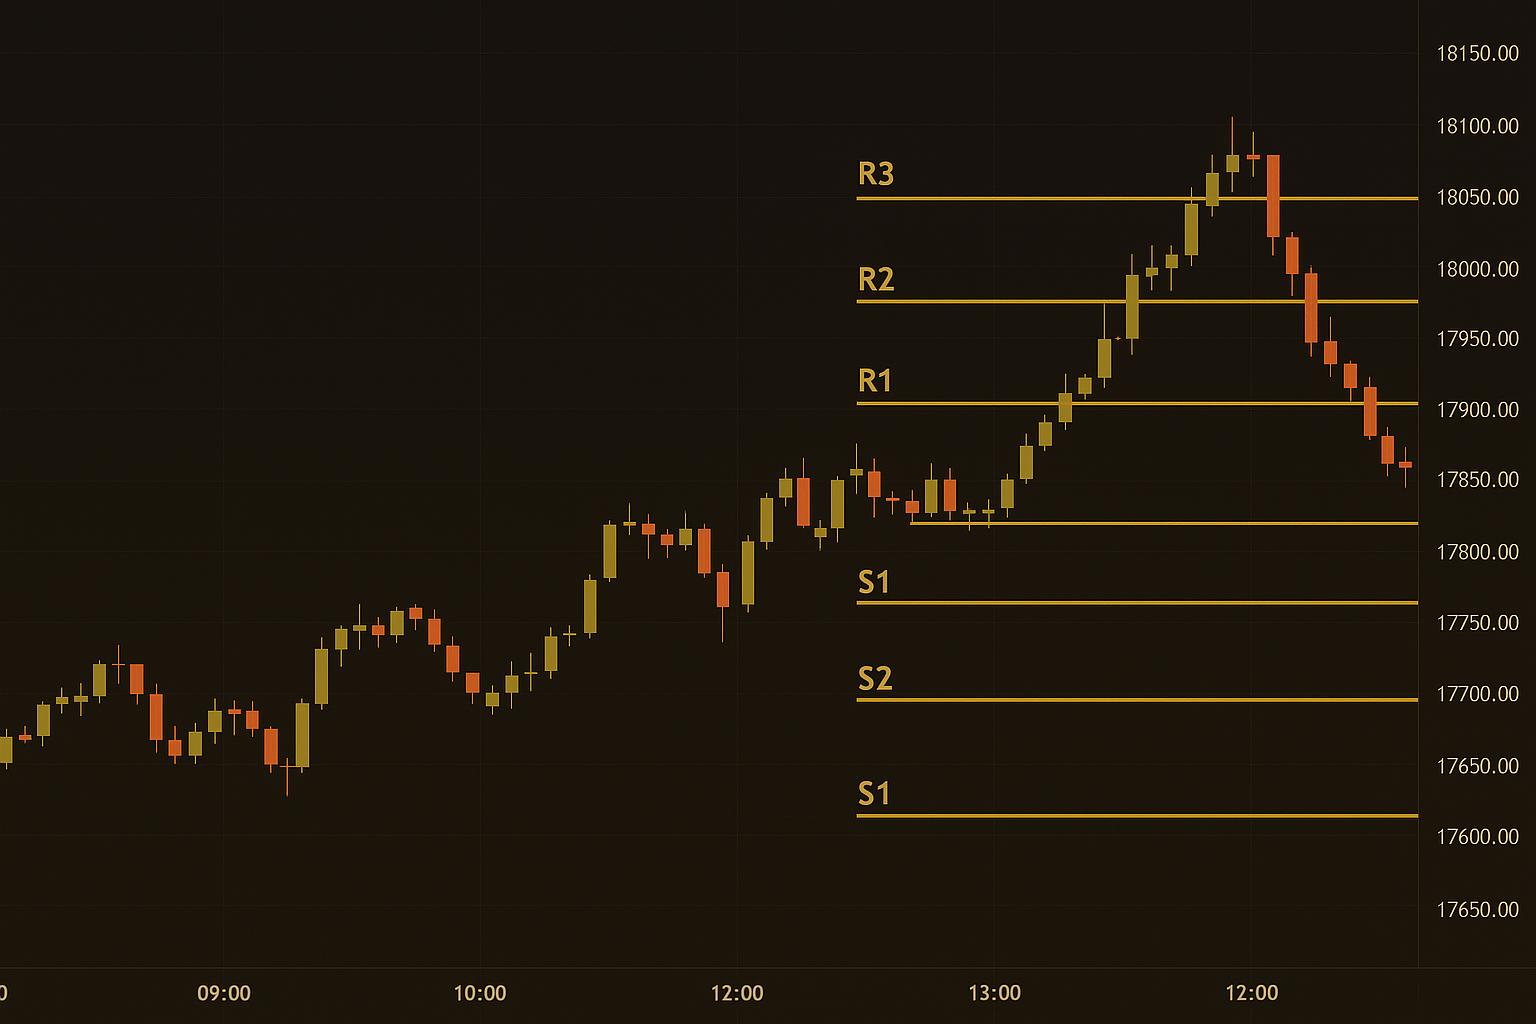
To understand Pivot Points deeply, one must see them not as mathematical constructs but as psychological checkpoints. They divide the market into zones. The central Pivot Point acts like a middle ground, the fair value area where buyers and sellers come to a temporary agreement. When price stays above this central zone, it reflects positive sentiment and a natural willingness of traders to buy dips. When price drifts below the central level, it reflects caution, fear, and a tendency for traders to sell into rallies. The surrounding levels, commonly known as support and resistance layers, define how far the market can stretch before pausing, reversing, or continuing its directional flow.
Even though Pivot Points are calculated from the previous day’s market behaviour, their influence on the current day often looks almost magical. This is not random. It is the result of collective trader memory. If the market rejected a zone the previous day, traders naturally react to that same zone again. If a level triggered a reversal earlier, traders expect a similar reaction again. Pivot Points quantify this expectation. They turn raw market psychology into structured, visible zones on the chart.
Why Pivot Points Still Dominate Trading in 2025
Many traders ask why Pivot Points still work despite everyone knowing about them. The answer lies in the universal nature of human behaviour and liquidity. Most trading systems used by institutions and proprietary desks are built on predictable reactions. Liquidity tends to accumulate at obvious zones because that is where orders cluster naturally. Since Pivot Points mark these obvious zones, they automatically become liquidity hubs. When thousands of traders watch a certain level, thousands of orders naturally get placed there. This increases order depth, slows down price movement around that area, and forces price to behave in a more structured manner.
In the Indian market, Pivot Points are especially important because index instruments such as NIFTY and BANKNIFTY react strongly to psychological levels. Indian markets show very clean behaviour at turning points, especially when volatility expands or contracts around news events. Pivot Points help traders get clarity during these moments. Price tends to hesitate, reverse, or accelerate exactly where Pivot levels lie. This consistency is what keeps Pivot Points relevant, even in the algorithmic era.
The Different Types of Pivot Point Systems Used Today
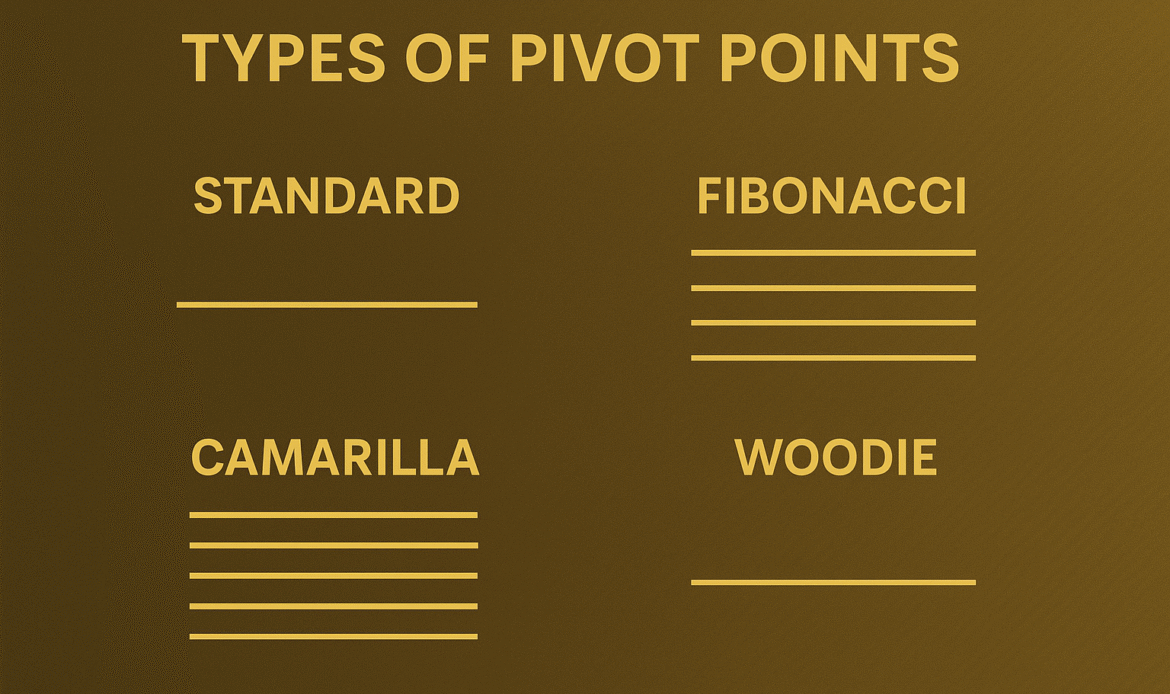
Even though the idea of Pivot Points is simple, several variations exist in modern trading. Each variation reflects a slightly different interpretation of market structure. Standard Pivot Points are the most widely used, especially among Indian intraday traders. They create a clean system of one central pivot with multiple supporting layers around it. Fibonacci-based pivots add the flavour of natural harmonic motion to these levels, creating zones that react beautifully during trending markets. Camarilla Pivot Points, popular among scalpers, generate extremely tight zones that work brilliantly for mean-reversion trades and quick intraday reversals. Woodie and Demark pivots are favoured by more advanced traders who want pivots that adapt slightly to current trend behaviour instead of only reflecting the previous session.
Each pivot system has its own personality. Standard pivots behave smoothly and are perfect for trend-following or breakout-based trading. Fibonacci pivots are wonderful for traders who believe markets behave in rhythmic waves. Camarilla pivots become the backbone of scalpers who prefer capturing smaller turns with high precision. Demark pivots act like an intelligent reversal system that identifies trend exhaustion zones. Even though each type is different, they all aim to create structure in the market and help traders understand potential turning points.
How Pivot Points Shape Trader Psychology
When traders look at charts, they subconsciously look for areas where the market might turn. Pivot Points simplify this process by presenting ready-made zones of reaction. When a trader sees the price hovering near a known pivot level, hesitation naturally occurs. Buyers become cautious and wait for confirmation. Sellers become alert and watch price behaviour closely. This hesitation itself creates predictable patterns on the chart. Rejection candles form. Long wicks appear. Doji structures reveal indecision. Breakouts become clear. Pullbacks become cleaner. All of these reactions occur because traders are collectively aware of the pivot zone.
The market becomes more rhythmic with well-defined pivots. Price rarely behaves chaotically around pivot points because large volumes of orders cluster there. When price accelerates through a pivot, it usually means sentiment is strong enough to overpower the cluster of orders. When price rejects a pivot, it means the opposing force is still dominant. This dance between acceptance and rejection is what gives Pivot Points their predictive power.
Intraday Trading Using Pivot Points
Intraday trading with Pivot Points becomes a highly structured process. Traders start their day by first identifying where the central pivot lies. If the market opens above this central line, there is a natural tendency for traders to buy dips. The market behaves as if support is stronger. Rejection candles near these zones often result in short bursts of upward movement. When price moves toward the upper pivot layers, traders observe whether momentum continues or slows down. When momentum slows, a reversal becomes more probable.
When the market opens below the central pivot, the entire mindset flips. Traders expect selling pressure on rallies. The central pivot becomes a ceiling instead of a floor. Rejections at this point often initiate strong short trades, especially in indices like NIFTY and BANKNIFTY, which respond sharply to momentum. Bank stocks, especially the heavyweights like HDFC Bank, ICICI Bank, and Kotak Bank, frequently follow pivot-based movements very cleanly, making them ideal candidates for intraday pivot trading.
Even when volatility spikes due to macroeconomic events, Pivot Points help define zones where price may stabilise temporarily. For traders who focus heavily on options buying, these pivot zones become crucial areas to time premium expansion and decay. A strong rejection around an upper pivot zone often triggers a sharp downward move, making put options lucrative. Similarly, a clean bounce from lower zones often boosts call option prices quickly.
Camarilla Pivots and the Art of Mean Reversion
Camarilla pivot levels deserve special attention because they form extremely tight levels that reflect short-term exhaustion. These pivots have become the favourite tool of Indian scalpers, especially those trading BANKNIFTY on expiry days. The idea behind Camarilla pivots is that price tends to oscillate between certain boundaries rather than immediately trending. When price approaches these boundaries, reactions occur almost mechanically. Traders who specialise in mean-reversion setups rely heavily on Camarilla levels to catch quick reversals that last for a few minutes to a couple of hours.
The charm of Camarilla pivots lies in how they compress the previous day’s movement into actionable bands. These bands capture the essence of where the market might pause, reverse, or explode. When price reaches the upper exhaustion band, traders naturally become cautious and start looking for exhaustion signs like rejection candles or sudden drop in momentum. Similar behaviour occurs at the lower band, where buying pressure frequently surfaces. These repetitive reactions help traders frame setups that feel almost systematic.
Understanding Pivot Rejections and Breakouts
Price often behaves beautifully around pivot levels, creating recognisable structures that traders can repeatedly use. A pivot rejection occurs when price approaches a pivot level but is unable to cross it decisively. This is often visible through long upper or lower wicks, sudden loss of momentum, or small-bodied candles that indicate indecision. A rejection from a central pivot is an early signal of potential reversal. A rejection from an upper pivot zone hints at exhaustion. A rejection from a lower zone suggests waning selling pressure.
On the other hand, pivot breakouts are equally powerful. When price crosses a pivot level decisively, the market usually enters a new phase of movement. Breakouts often come with strong candles, increased volume, and follow-through movement. Traders who prefer breakout trading find pivot-based breakouts extremely reliable. When the central pivot breaks, the entire market tone changes. When mid-level pivots break, the market accelerates its existing momentum. When the highest or lowest pivot band breaks, extreme volatility often follows.
Pivot Points in Swing and Positional Trading
Most traders assume Pivot Points work only for intraday trading, but swing and positional trades become far more structured when pivot zones are observed on higher timeframes. Weekly and monthly pivot points reveal deeper layers of support and resistance that do not appear clearly on daily charts. These zones often represent institutional footprints. When a stock hovers near a weekly pivot, large positions often get built by smart money. When a monthly pivot acts as support, it usually indicates broader market confidence in the stock. When these higher-timeframe pivots align with daily pivots, the market creates extremely powerful confluence zones that often result in major trend changes.
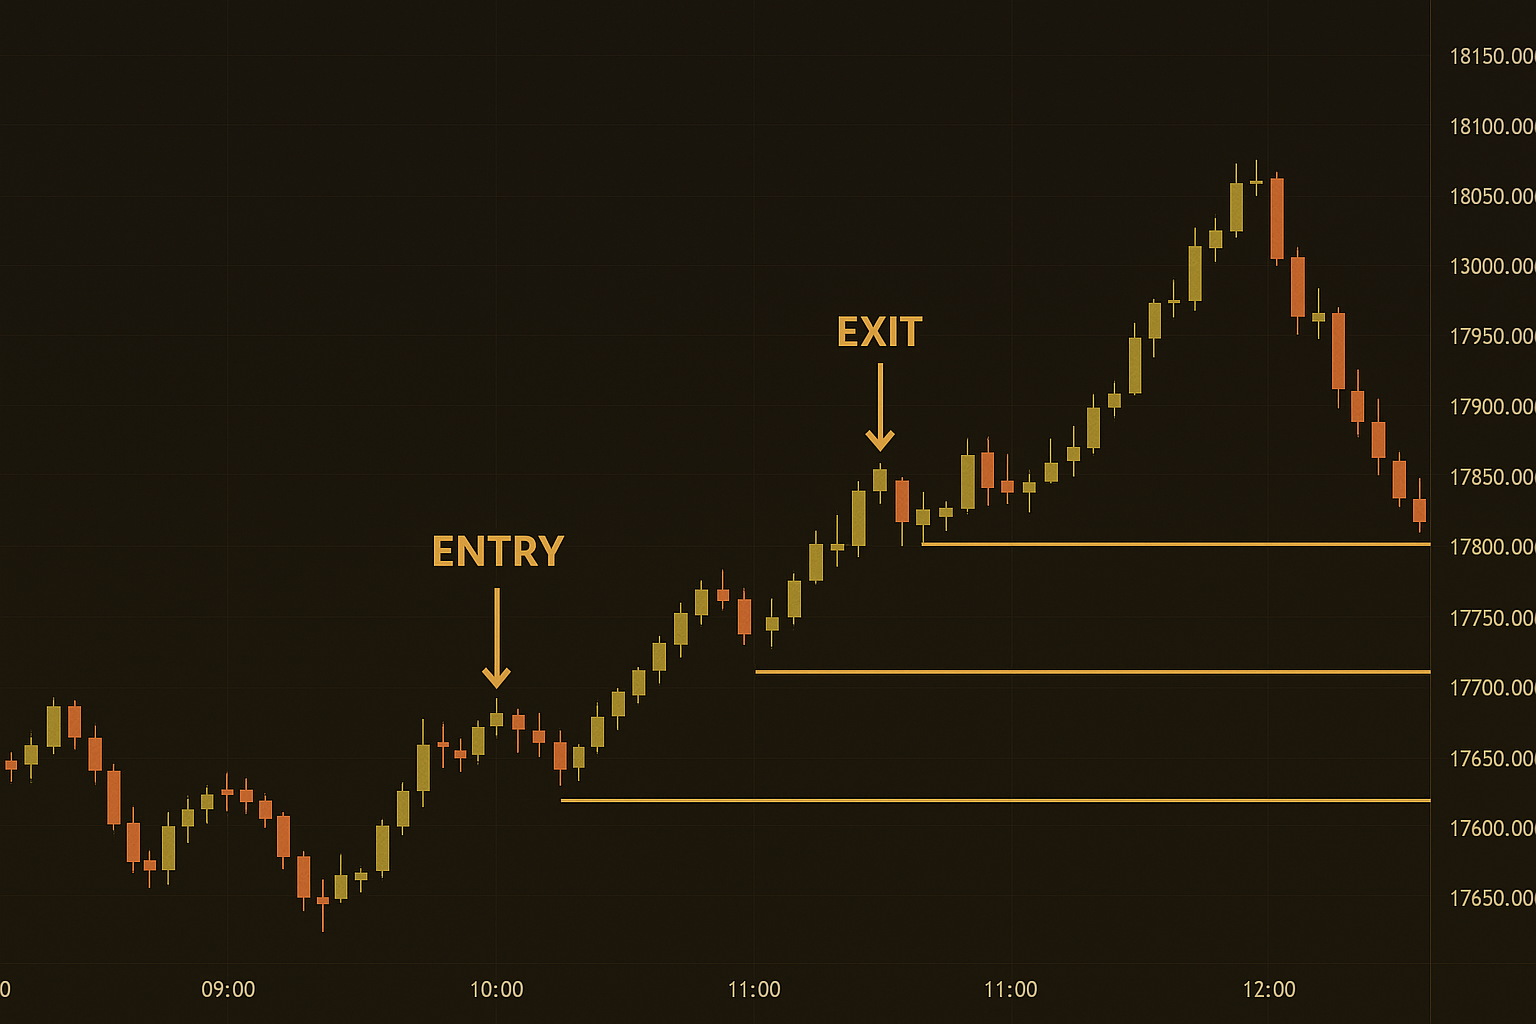
Swing traders can use Pivot Points to time entries better, especially in trending markets. A stock trending upward often dips toward its central pivot on lower timeframes before continuing the move. This provides low-risk entry opportunities. Similarly, positional traders use pivot zones to anticipate broader market reactions. When NIFTY approaches a monthly pivot, traders often witness attempts to stabilise the index, even during volatile months.
Pivot Points for Options Buyers
Options buyers rely heavily on momentum and precise timing. Pivot Points offer the clarity required for such trades. When the market rejects a pivot level convincingly, premium expansion happens quickly. Buyers can time their call or put entries with much greater confidence when they see rejection candles forming at major pivot layers. Even more importantly, pivot breakouts help directional option buyers capture strong moves early. When price crosses a pivot decisively, option premiums tend to expand rapidly, offering profitable opportunities.
Options buyers also rely on pivot zones to manage risk. When price approaches a pivot, buyers anticipate that premium behaviour will shift. A pivot rejection often makes the premium stabilize or reverse. A breakout often triggers premium acceleration. The simplicity of this behaviour helps option buyers avoid unnecessary trades and focus on high-quality setups.
Pivot Points for Options Sellers
For option sellers, Pivot Points offer predictable range boundaries. Markets often oscillate between two pivot zones for extended periods. This gives option sellers a clear idea of probable boundaries where market movement may remain contained. Pivot zones help sellers understand where short straddles or short strangles may remain safe. When the market stays between major pivot levels, sellers can capture theta decay comfortably.
Pivot zones also help sellers decide when to stay out of trades. When price approaches a major pivot boundary with strong momentum, sellers become cautious because volatility can break through ranges and cause rapid losses. When sellers combine pivot zones with volume and price behaviour, they get a clearer picture of how much premium risk they are carrying.
Pivot Confluence with Indicators like VWAP and RSI
Pivot Points become significantly powerful when combined with tools like VWAP and RSI. VWAP acts as a dynamic volume-based equilibrium. When price and VWAP align near a pivot zone, market reactions become highly predictable. A rejection at such a confluence often triggers strong reversals. A breakout near such a confluence often leads to fast trending moves.
RSI adds another dimension by showing exhaustion at pivot zones. When price touches a major pivot band and RSI shows divergence or overbought or oversold conditions, the probability of reversal becomes extremely high. Traders who have mastered these confluences often find pivot-based setups incredibly reliable.
Pivot Points and Price Action Patterns
Price action becomes clearer around pivot levels. Candle patterns like engulfing candles, pin bars, doji formations, inside bars, and strong momentum candles carry greater significance around pivots. For example, a bullish engulfing candle formed near a lower pivot band often indicates that selling pressure has exhausted. A bearish engulfing candle near an upper pivot band usually signals strong rejection. Traders can refine entries dramatically using these patterns.
Pivot Points and Market Psychology on Gap-Up and Gap-Down Days
Gap-up and gap-down openings have become very common in modern markets. Pivot Points help traders navigate these situations with clarity. When the market opens near an upper pivot band, there is a high probability of early profit booking or reversal. When the market gaps down near a lower pivot band, early recovery attempts are common. Pivot Points help traders understand whether the gap is likely to sustain or fade, giving them direction for options and futures trading.
Mastering the Art of Pivot Trading Through Observation
Even though Pivot Points are simple, mastery comes through observation. Watching how price behaves around pivot zones every day trains a trader’s mind to anticipate reactions. Over time, patterns become obvious. A trader learns when a breakout is real or when it is merely a trap. They learn when rejection means reversal or when it means temporary hesitation. They begin to notice how different stocks react differently. For example, BANKNIFTY reacts sharply around pivots while midcaps sometimes take time to decide.
Pivot Points reveal the personality of each instrument. Some instruments prefer clean bounces from the central pivot. Some prefer explosive breakouts beyond outer pivot layers. Some oscillate tightly between zones. Observing these behaviours creates a mental map that deeply enhances trading intuition.
Final Thoughts: Pivot Points Are Not Just Levels, They Are Market Logic
Pivot Points survive across eras because they reflect something deeply fundamental: price memory. Markets are not random. They behave in structured ways when large numbers of traders react to the same levels. Pivot Points turn this behaviour into a visible trading framework. They simplify decision-making. They bring clarity in chaos. They give structure to unpredictable markets. Whether you are an intraday trader, swing trader, option buyer, option seller, or a price action enthusiast, Pivot Points can refine your trading dramatically when used with understanding and patience.